Chaplin Estates, Deer Park, Summerhill, South Hill, The Annex, Republic of Rathnelly, Casa Loma, Wells Hill and Yorkville. See Statistics Below
Lower Midtown? Upper Midtown? I don’t think you can logically lump all of Midtown Toronto into one housing statistic and get a clear view of what’s happening. As a Torontonian from a family of many generations in this vibrant city, I value neighbourhoods, their history and individuality. Hence, I have created Lower and Upper Midtown MLS Maps with similar houses types, values and styles of properties.
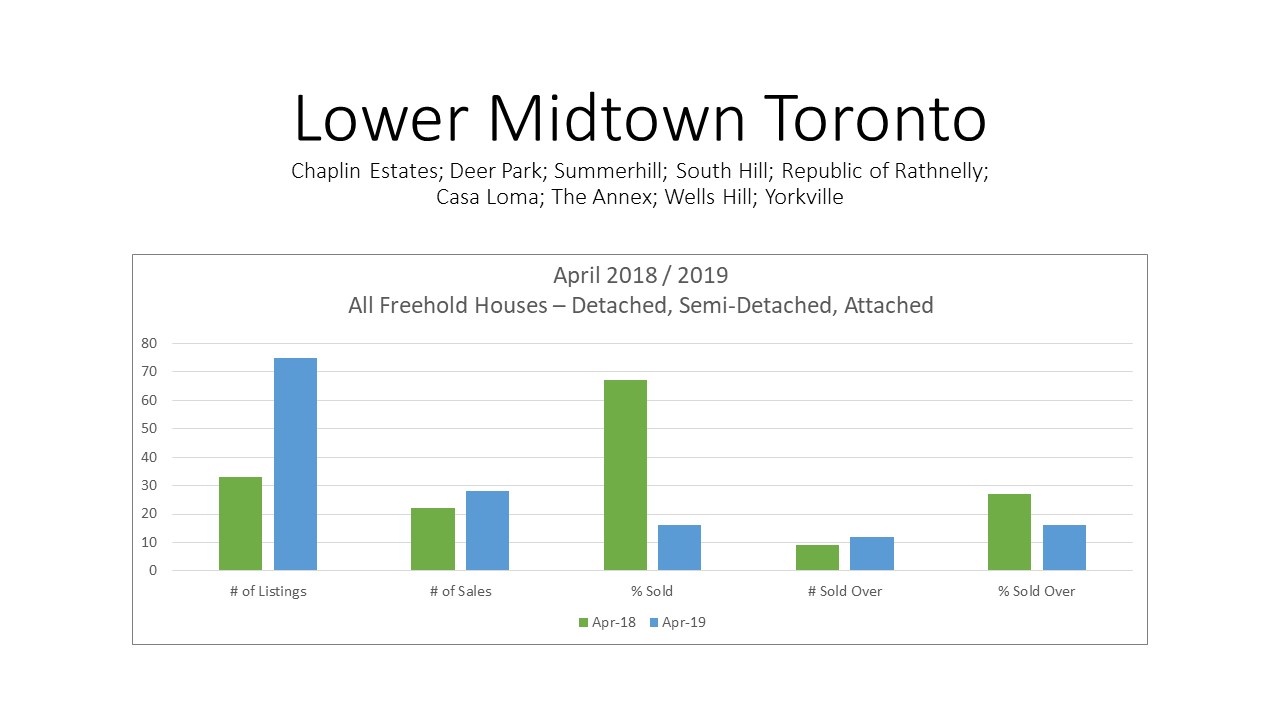
I prefer to look at High and Low Sold Prices rather than Median or Average Sold Prices in a narrower search. An exceptionally High or Low Sold Price will skew the numbers and make a bigger difference in the Average or Median Prices making it appear that the market is either rising or falling more than it actually is.
While there are more listings on the market, the number of sales has risen only slightly. But, the number of multiple offers has also risen slightly indicating strong Buyer expectations.
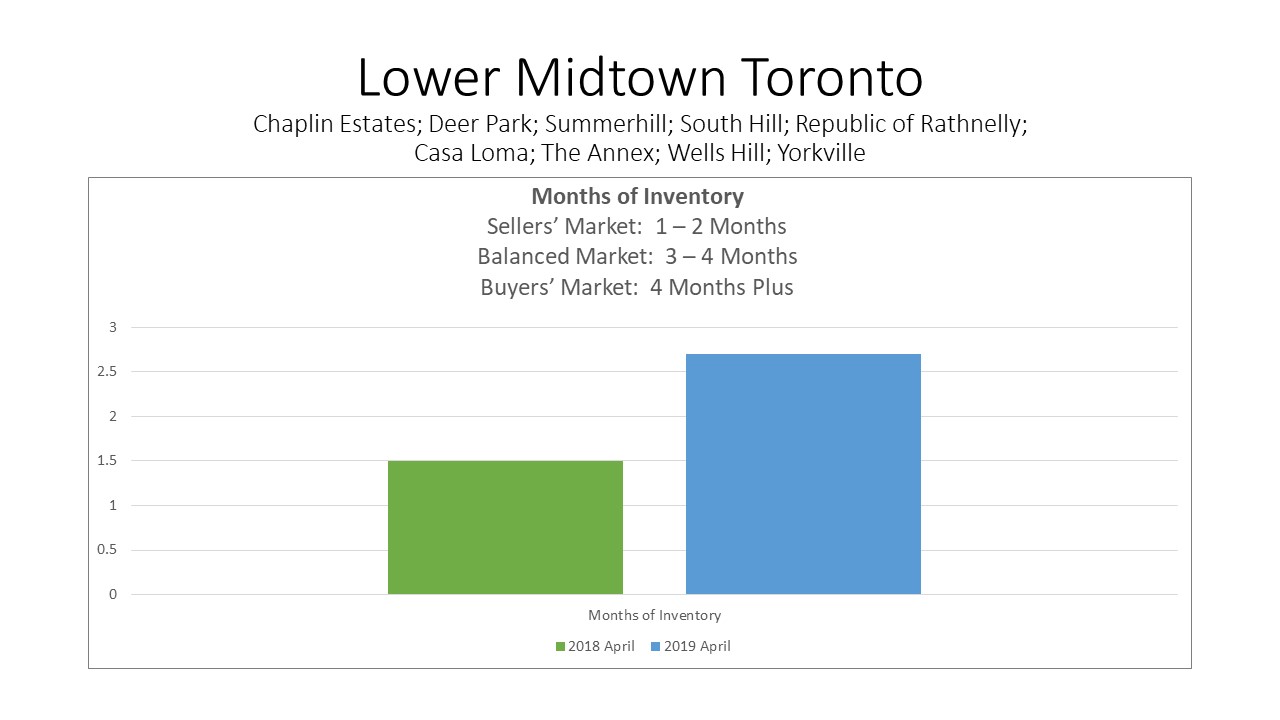
The Months of Inventory is approaching a Balanced Market which means it may take a little more time to sell a home. It is, therefore, even more important to declutter and prepare your home for sale before putting it on the market. Staging does pay. Ask me for more details on this.
Want detailed statistics pertaining to your own house? Call me, I would be happy to provide them.
And check back often as I will upload statistics regularly.